
Profile your java application with visualvm (part 1 of 2)

Application profiling is another measure of software quality. It enables developers, as well as testers, to get an overview about software performance and runtime behavior. Luckily for Java developers, there are plenty of available free profilers. In this article, I’m going to talk about VisualVM.
VisualVM is developed by Oracle and is shipped by default with the JDK starting from Java 6 update 7. You can download it from the official website, if you can’t find it in the bin directory of your JDK folder.
One of the nicest things about VisualVM is that it gives you a detailed view of what’s going inside the JVM while your application is running. You can see the allocated memory size of the different regions of the heap, CPU consumption, total number of running threads, and many other performance metrics.
It has an Eclipse plugin which enables you to quickly launch your application as configured inside Eclipse and start monitoring it immediately.
There are three tabs in the main GUI:
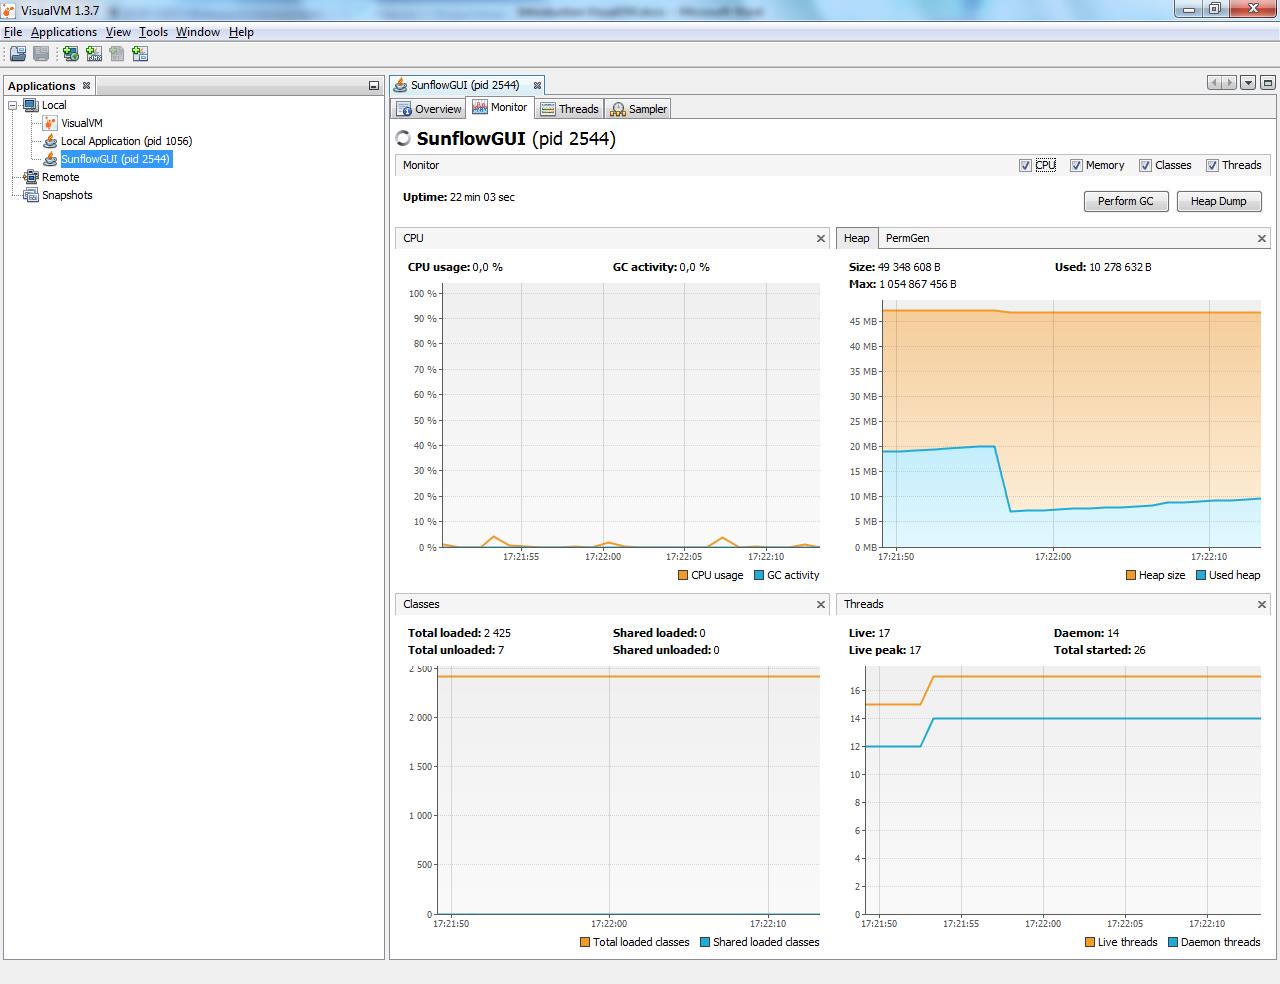 Figure1. VisualVM main window
The Monitor tab shows various statistics about application performance and memory consumption in real time. This information gives you a quick idea about how your application is doing and how intensive it is with CPU usage.
There are two buttons on the top right corner:
- Perform GC: explicitly execute garbage collection and free unused objects
- Heap Dump: generate a report about the current contents of the heap
The Thread tab shows a list of live and finished threads. Colors are used to distinguish between different thread states.
- Running: thread is still running
- Sleeping: thread is sleeping (method yield() was called on the thread object)
- Wait: thread was blocked by a mutex or a barrier, and is waiting for another thread to release the lock
- Park: parked threads are suspended until they are given a permit. Unparking a thread is usually done by calling method unpark() on the thread object
- Monitor: threads are waiting on a condition to become true to resume execution
The Sampler tab allows you to do CPU/memory sampling and measure execution speed in terms of how much time each method call took. Four different measures are shown here:
- Self Time: total time spent invoking this method. If a method was called twice, the self-time will be the sum of the time spent in each call excluding internal method calls.
- Self Time (CPU): the same as Self Time except that only CPU execution time is considered, omitting I/O operations.
- Total Time: total time spent invoking this method including internal method calls.
- Total Time (CPU): total CPU time spent invoking this method including internal method calls.
Examine the heap with VisualGC
VisualGC is a plugin for VisualVM which allows you to inspect the internal heap state in great detail (see Figure 2). You can simply install it by going to Tools > Plugins > Available Plugins then search for “Visual GC”.
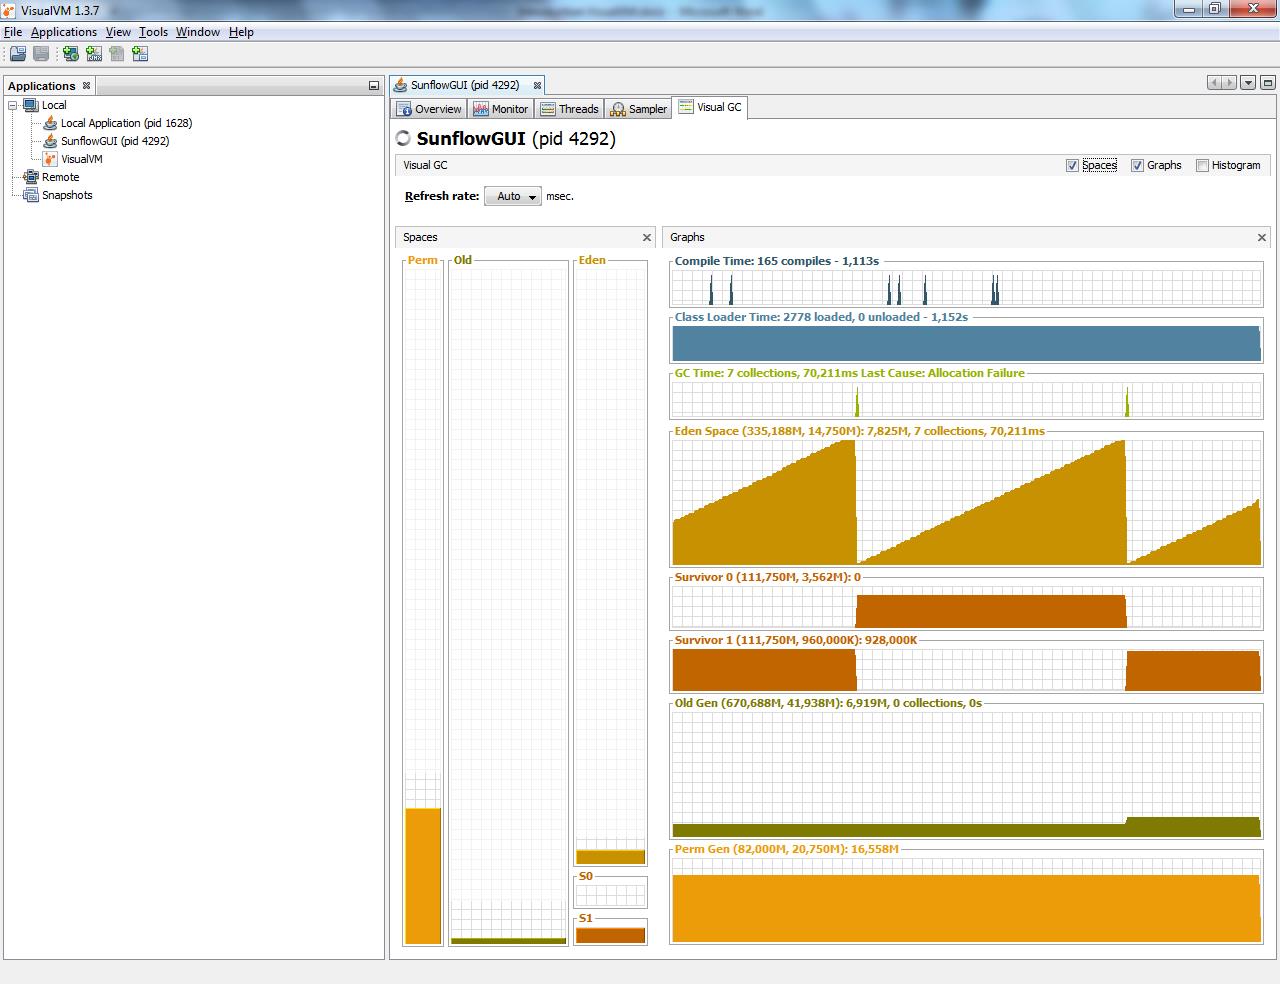 Figure 2. VisualGC
The Java heap is divided into 3 areas known as generations. Each generation holds a particular set of objects based on how long they’ve been inside the heap. The old generation contains objects that have survived for a relatively long period of time. The young generation contains newly allocated object, and itself is divided into 3 regions (Eden, Survivor 0, and Survivor 1).
When an object is first instantiated, it will be stored in Eden space, and when it reaches a certain age threshold, it gets promoted to S0 then S1. Objects in S0 or S1 will eventually be moved to the old generation and persist there as long as they are still referenced.
Finally, the permanent generation, also known as PermGen, contains application metadata and klass objects (instances of Class).
Conclusion
In the next and final part of this article, we will delve more into code profiling and learn how we can find performance bottlenecks so we can fine tune the JVM to achieve maximum application throughput.